
Training Materials for Inclusive Sample Reporting
The following pages include examples of sample descriptions from various articles, spanning across a range of different contexts, and including quantitative and qualitative work. Each article illustrates a few different ways of emphasizing diversity within the sample in the given context and addressing some of the issues mentioned in the Guidelines and Examples for Reporting Sample Demographics. The main strengths of each article in this regard are summarized below each excerpt. Although no one article addresses all aspects of sample diversity that could be considered, taken together across all articles you can see which aspects could be combined and adapted to the specific context of your research.
examples
QUALITATIVE RESEARCH
Reference: Coşkan, C., & Şen, E. (in press). "If I die, my children will pursue this case": Counternarratives of power in Kurds. Peace and Conflict: Journal of Peace Psychology. https://psyarxiv.com/4npgq/
Sample [abbreviated]
We went beyond our existing networks to reach people whose voices are generally not heard within the usual activist networks. (…) Therefore, as two researchers interconnected to diverse Kurdish communities (i.e., human rights organizations, press workers, and non-formal acquaintance networks), we used our personal connections to reach Kurds from diverse socioeconomic backgrounds and political orientations. We aimed to reach a heterogeneous sample, representing different political orientations/engagements and religious groups. (…) We interviewed 16 Kurds, 9 from Van (3 women) and 7 from Istanbul (2 women). The sample (see Table 1) was considerably heterogeneous in terms of political orientation (e.g., supporters of the KLM, Human and Freedom Party – HFP, Kurdistan Democratic Party – KDP, Gorani Movement, HDP, CHP, anarchist and socialist ideologies), socioeconomic class and job area (e.g., building worker, shopkeeper, NGO worker, and dismissed municipality officer). (…) We asked the counternarrators their wish for the interview language to provide Kurdish simultaneous translation in Istanbul. The interview language was Turkish except for one interview, which was conducted in Kurdish upon the counternarrator's wish.
Excerpt from Table 1 (one of several pages):
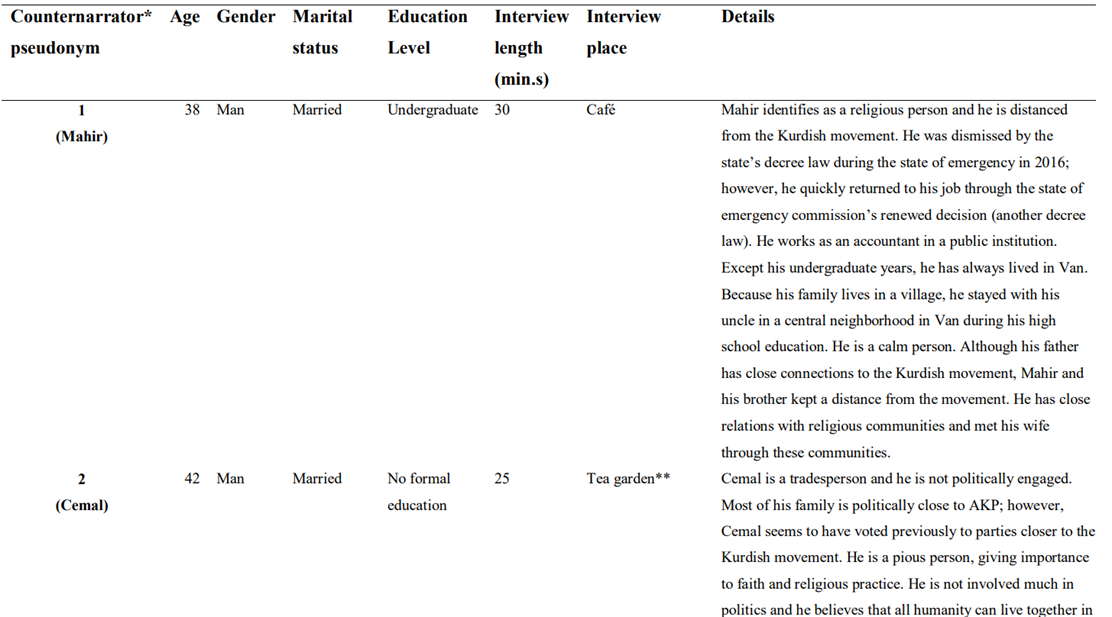
- Addresses efforts to diversify the sample (Guideline 6)
- Pays attention to political ideology (especially relevant given the study topic), social class, and location (each place has a specific meaning in terms of the demographic composition and history, one being the capital and one a city where the national minority group in question is the majority. (Guidelines 1 & 3)
- Also pays attention to language participants speak, given bilingual background of many participants and the political meaning of language in this context (Guideline 1)
- Table 1 provides a detailed description of each participant's background, going beyond the main demographic characteristics and providing additional information that helps contextualize the participant's answers (Guideline 5)
‼ If word limits do not permit a more extensive Table, it can also be moved to the online supplementary materials.
Reference: Figueiredo, A., Oldenhove, G., & Licata, L. (2018). Collective memories of colonialism and acculturation dynamics among Congolese immigrants living in Belgium. International Journal of Intercultural Relations, 62, 80-92. https://doi.org/10.1016/j.ijintrel.2017.03.004.
Participants [abbreviated]
Forty-three participants took part in the present study. (…) All participants were born in the Congo, at the exception of two: one was born in Belgium and the other one in Rwanda; both had Congolese nationality. In terms of nationality, 21 participants were Congolese, 20 were Belgian, one had double nationality, and one had Dutch nationality. The age range of the sample was 18–65 years old (M = 40, SD = 11) and 70% of the participants were male. At the time of the interview, the duration of the participants' stay in Belgium ranged from one year and a half to 40 years (M = 16 years, SD = 12). Twenty-seven participants had a university degree, 6 had a short-term higher degree (non-university), and 6 completed general secondary education. Of the remaining 4, 2 had completed technical/professional secondary education and the other 2 had completed junior education. In terms of occupation, 19 participants reported to be employees, 9 were students or in training, 5 were self-employed, 5 were unemployed, and 2 were manual workers. Finally, one participant reported to be a manager/executive, one to be an employee in a family business and the remaining one to be retired. For further details about the demographic characteristics of the participants, see Table 1. [Note: Table 1 lists for each participant all characteristics mentioned in this summary]
Reference: Nair, R. & Vollhardt, J.R. (2019). Intersectional consciousness in collective victim beliefs: Perceived intragroup differences among disadvantaged groups. Political Psychology, 40, 917-934. https://doi.org/10.1111/pops.12593
Samples
Dalit participants in both studies were mostly Hindus, and three were Buddhists (we excluded Dalit Muslims, as the overlap between the two identities would make it difficult to compare the findings). Among Muslims, we focused on Sunnis, as they form the vast majority of Indian Muslims. Study 1. This sample included 16 Dalits and 17 Muslims (N = 33) from middle-class backgrounds. There were equal numbers of men and women from each group (with one exception: There were nine Muslim men). Ages ranged from 21 to 84 years (M = 33.82; SD = 12.74). The sample was highly educated; except for two participants with high school degrees, all participants held at least a Bachelor's degree. Participants' occupations included government officials, lawyers, accountants, engineers, homemakers, activists, library assistants, students, teachers, and tailors. Study 2. Participants were recruited from six shantytowns built without legal permits and with scarce access to electricity, safe water, and sanitation facilities. Twelve focus group discussions were conducted (four with Dalit women; three with Muslim women; two with Dalit men; three with Muslim men). The overall sample (N = 66) included 19 Dalit women, 15 Muslim women, 8 Dalit men, and 24 Muslim men. While many participants did not know their exact age, based on participants' estimates, the approximate average age of Dalit men was 49 years, Dalit women 43 years, Muslim men 44 years, and Muslim women 33 years. All participants came from very poor backgrounds, and most had received minimal formal education. Over one-third (n = 24) had never attended elementary school; more than half (n = 36) had less than a 10th-grade education; only four had completed 10th grade and two 12th grade, and none had attended college. Muslim participants had on average 3.6 years and Dalits 4.3 years of education. Participants worked as daily wage laborers, cycle-rickshaw drivers, domestic helpers, shopkeepers, sanitation workers, and homemakers.
- Considers intersecting identities relevant in the local context – religion, caste, social class, gender. (Guidelines 1 & 3)
- Reports subsample size and sample statistics on age for different intersecting social categories (gender/specific minority group based on caste or religion) (Guideline 6)
- Uses two different indicators of social class (education and occupation), in addition to location/living conditions (Guideline 1)
Reference: Noyola, N., Sánchez, M., & Cardemil, E. V. (2020). Minority stress and coping among sexually diverse Latinxs. Journal of Latinx Psychology, 8(1), 58–82. https://doi.org/10.1037/lat0000143
Participants
We recruited 18 adults (Mdn age = 24.5 years; range = 18–37) who self-identified as both Latinx and sexually diverse (i.e., lesbian, gay, bisexual, pansexual, and queer) and who were currently living in the U.S. Most participants identified as women (n = 10, 55.56%), followed by men (n = 6, 33.33%) and gender-queer/genderfluid (n = 2, 11.11%). Six (33.33%) identified as bisexual, five (27.78%) identified as gay, four (22.22%) identified as lesbian, and three identified as pansexual/queer (n = 3, 16.67%). Four (22.22%) participants preferred to complete the interview in Spanish. One additional participant preferred to complete the interview in Spanish and English. To contextualize the data, we report participants' sociodemographic information, including self-reported racial identity, age, highest level of education completed, income, country of birth, and geographic area at the time of the study in Table 1.
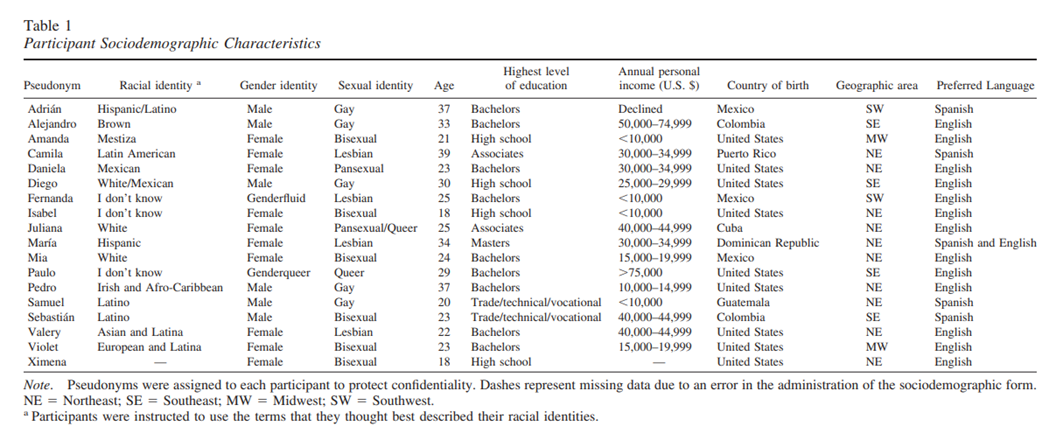
- Reports multiple social categories intersecting with racial identity and relevant to the context: country of birth, language, region in the U.S. (Guidelines 1 & 3)
- Participants describe their racial identity themselves instead of using pre-defined categories (Guideline 2)
- Multiple, inclusive options for sexual identity and gender identity are reported, beyond the most commonly used ones (Guideline 2)
- Additional detail that is not reported in the text is provided in a table. (Guideline 5)
Reference: Pickens, C., & Braun, V. (2018). "Stroppy bitches who just need to learn how to settle"? Young single women and norms of femininity and heterosexuality. Sex Roles, 79, 431–448 (2018). https://doi.org/10.1007/s11199-017-0881-5
Design and Participants [abbreviated]
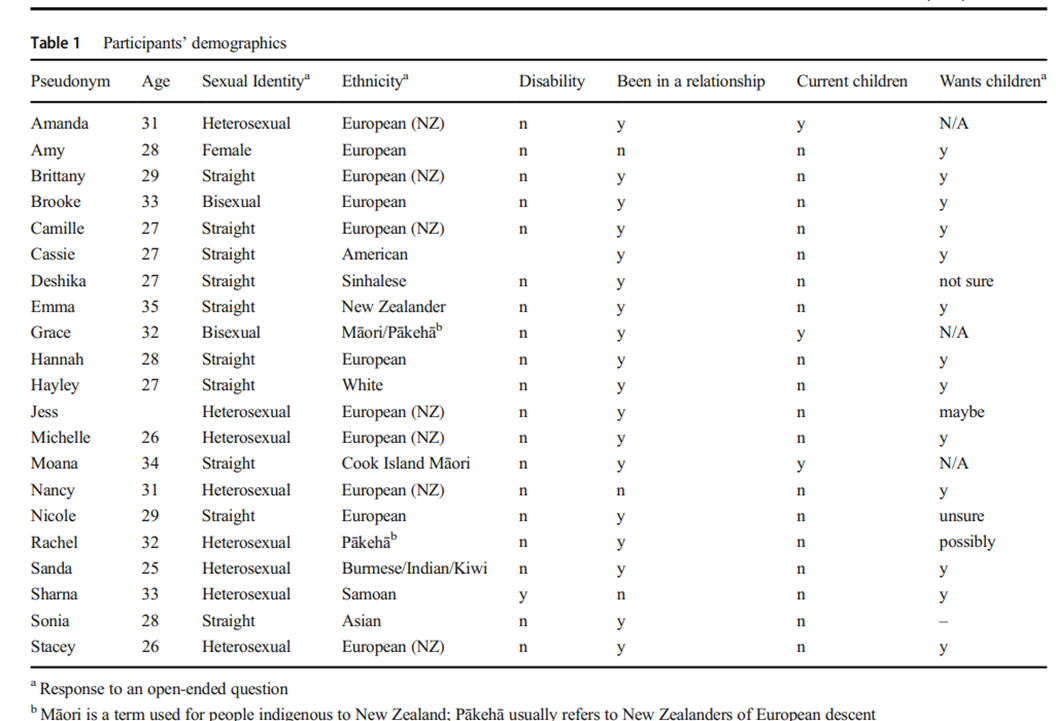
We utilised a semi-structured individual-interview design to talk to (mostly) heterosexual single women about how they understand, make sense of and report acting in relation to being single, with a focus on heterosexuality. (…) The population was conceptualised around the following parameters: heterosexual and currently single women aged 25–35, living in Auckland and having resided in New Zealand for more than 2 years (to locate the study within the local sociocultural context) and who spoke fluent English. This age bracket captures typical and common childbearing years (…), as well as a time when women may start to feel heightened scrutiny or pressure surrounding their single status. (…) Following approximately 130 expressions of interest, we adopted a diversity-sampling principle (Patton 1990) to try and hear stories from women who had a range of relational, life, and identity positions. We invited 21 women to participate in an interview, and all agreed. The 21 participants were chosen due to a range of factors, such as availability, location (many expressions of interest were from outside our wider location), and diversity in demographics such as age, ethnicity, and occupation. The 21 participants identified with a range of occupations (e.g., make-up artist, engineer, nurse, administrative jobs), whereas some identified as students (n = 6), or provided no occupation information (n = 4). Participants appeared to represent a variety of sociopolitical views, with some reporting being passionate about social and/or feminist issues whereas others appeared less or not engaged in such issues.
- Provides rationale for the age group that is sampled and explains why certain ages are excluded (Guideline 4)
- From a larger pool of interested participants, selected a subset based on diversity-sampling criteria (Guideline 6)
- Reports intersecting social categories of sexual identity, ethnicity (and race though based on the context this term is not used), disability in addition to background characteristics that relate to the research topic (relationship status, children) (Guidelines 1 & 3)
- Allows participants to self-report their sexual identity and ethnicity in their own terms, through open-ended questions instead of providing limited close-ended answer options (Guideline 2)
- More detailed participant information that goes beyond the text is reported in the Table (which reports for each participant because this is a qualitative study, but for a larger sample in a quantitative study this information could be aggregated) (Guideline 5)
QUANTITATIVE RESEARCH
Reference: Albzour, M., Penic, S., Nasser, R., & Green, E. G. T. (2019). Support for "normalization" of relations between Palestinians and Israelis, and how it relates to contact and resistance in the West Bank. Journal of Social and Political Psychology, 7(2), 978-996. https://doi.org/10.5964/jspp.v7i2.877
Participants and Procedure [abbreviated]
A cross-sectional survey was administered in 2016 among a sample of 159 Palestinian adults in the West Bank. The survey was part of the Pluralistic memories project (see http://wp.unil.ch/pmp/). Respondents were recruited by a local research institution using randomized network-sampling (…). While this procedure does not result in a representative sample of the population, it allows for a more diversified sample than convenience or non-systematic snowball sampling. Data was collected in cities, villages, and camps (29%, 44%, 27%, respectively) in three Palestinian regions (i.e., governorates) from the north, central and south of West Bank (33%, 33%, 34%, respectively). The questionnaire was administered in Arabic in face-to-face interviews. The sample consisted of 59 female and 100 male respondents (Mage = 42 years, SD = 12.06, 77% were married). Respondents rated their economic class: 4% of respondents described themselves as poor or somewhat poor, 76% as belonging to the middle class, 17% to upper middle class and 3% as rich. Regarding the level of education, 50% of respondents had a university degree, 26% had finished secondary school, 21% finished primary school and 3% had no formal education.
- Sampling procedure considerations for increasing the diversity and generalizability of the sample is discussed (Guideline 6)
- Reports on variation in regions and location (Guideline 1)
- Variation in socioeconomic status is reported as well, with two different indicators (Guidelines 1 & 3)
Reference: Chung, J. M., Meijer, L., Zonneveld, R., Al Sawaf, Z., Alajak, K., Moopen, N., Rahim, H., Çiftçi, L., Alisic, E., Stellar, J. E., Mooren, T., Sleijpen, M., Tešanovic, T., Al Baker, H., Dali, R., Papadantonaki, M., Papakosta, N., Antink, M., Charisopoulou, S., … Laceulle, O. M. (2022). Lessons learned from conducting a study of emotions and positive personality change in Syrian origin young adults who have recently resettled in the Netherlands. European Journal of Personality, 36(4), 665–682. https://doi.org/10.1177/08902070221081319
Participants (abbreviated)
At the first assessment, participants included 168 Syrian origin young adults who were currently residing in the Netherlands (70% self-identified as male, 30% as female; Mage = 28.1 years). Tables 1 and 2 include additional background data provided by our participants at the first assessment. The majority of our participants identified as Arab, as heterosexual, and with the religion of Islam. Additionally, more than half of our participants held a university degree. Moreover, nearly all of our participants had refugee status in the Netherlands, and the majority chose "unsafety because of the conflict in Syria" as a primary reason for leaving Syria. Furthermore, more than half of our participants reported living in another country for more than 3 months before coming to the Netherlands, and on average, participants had been in the Netherlands for 3 years (M = 36.5 months, SD = 15.73). It is interesting to note that 50% of the Syrian population in the Netherlands is between the ages of 18- and 35-years-old, that the majority are male, and that generally high levels of education (Refugee Work Netherlands, 2020).


- reports relevant intersecting identities (ethnicity, religion) in addition to Syrian origin, and other demographics (education, sexual identity), showing heterogeneity within the sample instead of assuming homogeneity among Syrian refugees (Guideline 3)
- very detailed information on several sample characteristics related to the main topic of the study (refugee status, immigration-related variables) (Guideline 1)
- uses tables to summarize additional details (Guideline 5)
- includes statistics on the population of interest, allowing the reader to compare with the sample statistics in the study concerning how representative and generalizable they are to this population (Guideline 6)
Reference: Grigoryan, L., Cohrs, J. C., Boehnke, K., van de Vijver, F. (A. J. R. ), & Easterbrook, M. J. (2022). Multiple categorization and intergroup bias: Examining the generalizability of three theories of intergroup relations. Journal of Personality and Social Psychology, 122(1), 34–52. https://doi.org/10.1037/pspi0000342
Pilot study to determine relevant social categories in 4 different countries included in the study:
The experts in each country responded to a semistructured online questionnaire. The instruction read: "Please go through the list of different possible dimensions for categorizing people into groups and rank these dimensions in terms of how relevant or important they are in [Country] for people's perceptions of each other." The list of dimensions was based on group memberships that frequently appear in studies of intergroup relations: gender, age, occupation, education, income, political views, place of residence (within country), citizenship, migration status, religion, race, ethnocultural background, mother tongue, proficiency in [country's official] language, ability/disability, and sexual orientation. Then, experts were asked: "Are there any other important ways of categorizing people in [Country] that were not listed above? Please list all the categorization dimensions that were not mentioned before."
We then integrated the results of within-country analyses. Gender, occupation, income, and ethnocultural background were found to be important in all four countries; age and education in three countries; race, religion, and place of residence in two countries. All these dimensions were included in the main study in all four countries. We combined the dimensions of ethnocultural background and race, because both refer to socially constructed cultural groups based on origin. Additionally, there were categorization dimensions that were identified as important only in one of the countries. Proficiency in the country's official language (English) was important only in Australia, sexual orientation in Armenia, political views in Brazil, and caste in India. These dimensions were incorporated (…) as country-specific dimensions.
Main study:
We aimed for functional equivalence (…) of selected groups rather than an exact match between countries (e.g., religious groups differed across countries, but always represented the majority and the largest minority religion in the country, plus a category of not religious). To select the groups to represent the dimensions that were closely linked to the country context (e.g., ethnic or religious groups), we conducted two to four informal interviews with residents of each country. For ethnicity and religion, we included the majority ethnic group in each country and two minority groups with relatively high and low status. For the dimensions of education, occupation, and income, the groups were selected to represent conceptual categories low, average, and high, but the specific labels were selected to be relevant to the local context. (…) Table 1 summarizes the categorization dimensions and categories included in the vignette setup in each country. We provide a more detailed account of dimension and category selection in each country in the online supplemental materials.
Participants. Aiming to overcome the underrepresentation of minority groups in studies of intergroup relations (…), we used nonprobabilistic quota sampling to represent all the social groups that were included in the vignettes.

- Considers multiple intersecting social categories and variation within these in terms of status (Guidelines 1 & 3)
- Uses quota sampling to represent minority groups within these categories instead of defaulting to the majority/dominant groups (Guideline 3)
- Uses a pilot study with expert interviews to determine which of the possible and intersecting social categories are most relevant in the given societal context, which then informs the study design and sampling in the main study (Guideline 6)
- Integrates both shared and context-specific, locally relevant categories across four different national contexts (Guideline 1)
- Detailed sample information is shared concisely in a table, and even more detailed sample and context information (including rationale for the selection) is provided in the online supplementary materials (Guideline 5)
Reference: Iqbal, Y., & Bilali, R. (2018). Seeking justice in the aftermath of collective violence: Predictors of Bangladeshi youth's interest in justice and preferences for retributive and restorative justice. Peace and Conflict: Journal of Peace Psychology, 24(3), 364–373. https://doi.org/10.1037/pac0000337
Sample
The sample included 652 participants (Mage = 20.03, SD = 1.29) who were recruited in October of 2014 and February of 2015 through flyers at one of the largest public universities in Bangladesh, Shahjalal University of Science and Technology. The sample was predominantly (71.6%) male, reflecting the higher proportion of males attending university in Bangladesh. It was also predominantly Muslim (74.8%), similar to the population of the country. Participants came from highly educated families (74.8% had parents who were educated above secondary level). Participants reported that their families had been highly affected by the 1971 war: 15.7% of participants reported having a family member killed in the war, 46.6% reported a family member injured, 62.5% reported property being destroyed or lost, and 48.8% reported their family being displaced by the war. Overall, participants described themselves as secular (M = 5.21, SD = 2.16 on a seven-point scale).
- Contextualizes and explains underrepresented demographic backgrounds in the sample (e.g., gender) (Guideline 4)
- Compares sample composition with population statistics for one variable (Guideline 6)
- Includes additional information that is relevant in the local context (religious versus secular) (Guidelines 1 & 3)
- Includes additional background information that is relevant to the research question (personal family experience of collective violence that was the topic of the study) (Guideline 1)
Reference: Kanazayire, C., Licata, L., Mélotte, P., Dusingizemungu, J. P., & Azzi, A. E. (2014). Does identification with Rwanda increase reconciliation sentiments between genocide survivors and non-victims? The mediating roles of perceived intergroup similarity and self-esteem during commemorations. Journal of Social and Political Psychology, 2(1), 489-504. https://doi.org/10.5964/jspp.v2i1.319
Participants
The study was conducted in 2009 at the Institute of Agriculture, Technology and Education of Kibungo (INATEK) located in the Eastern Province of Rwanda. Participants were students at the Faculty of Psychology and Education in their 3rd and 4th years of bachelor's degrees. The only inclusion criterion was to be Rwandese.
The sample comprised 247 students (203 women), including 113 genocide survivors (referred to as survivors), and 134 people who were not victims (referred to as non-victims). 49 persons who were abroad during the genocide also completed the questionnaire, but their answers were not included in the present study. Participants were between 20 and 55 years old (M = 30.74, SD = 8.41) at the time of data collection, in 2009. Most of them (62.3%) were at least 10 years old in 1994, and 81.5% of them declared they had lost at least one relative in this genocide, 99.1% among the survivors and 73.9% among the non-victims.
The relatively high number of survivors in the sample, compared with their demographic representation in Rwanda, could be attributed to two factors: genocide survivors might be more represented in psychology departments, which could be linked to their personal motivation to learn more about trauma and counseling in order to help their relatives and colleagues dealing with genocide-related trauma. This cannot be ascertained given the absence of statistics about ethnicity in post-genocide Rwanda. The other possible explanation is that genocide survivors could have been more interested in participating in a study about reconciliation and commemoration of the genocide than non-victims. However, these are just tentative explanations that could not be tested in the present study.
Procedure
(…) For obvious reasons linked with the post-genocide context, it was not possible to administer different questionnaires to members of the survivor and non-victim groups, or to include questions about ethnicity in the questionnaire. In order to distinguish members of the two groups, participants were asked to state if they were in Rwanda during the genocide and to self-identify as either survivor or non-survivor. For the purpose of this study, a genocide survivor was defined by reference to the definition proposed by the Ibuka association and approved by the government: "a genocide survivor is anyone who was chased from 1/10/1990 until 31/12/1994 because of his/her ethnicity or ideology to fight against the genocide of the Tutsi". Therefore, although we can expect that most participants who self-identified as survivors belonged to the Tutsi ethnicized group, this category could also comprise members of moderate Hutu families who were also persecuted during the genocide period.
- Explains inclusion and exclusion criteria for sampling and discusses that and why certain characteristics were overrepresented. (Guideline 2)
- Provides background information that is relevant to the topic of the study—personal experiences in relation to and age at the time of the genocide. (Guideline 1)
- Notes that it was not possible to ask about ethnicity (this is illegal in Rwanda) and explains which information that is legal was collected instead. (Guidelines 1 & 6)
Nelson, S. C., Syed, M., Tran, A. G. T. T., Hu, A. W., & Lee, R. M. (2018). Pathways to ethnic-racial identity development and psychological adjustment: The differential associations of cultural socialization by parents and peers. Developmental Psychology, 54(11), 2166–2180. https://doi-org/10.1037/dev0000597
From the Participants and Procedure section [only a part of what was described]:
The demographics for this study are reported in Table 1. The sample was majority female at each wave of data collection (61–73%). Participants self-reported their ethnic-racial group in their own words, which were then coded by researchers, see Table 1.(...) Individuals identifying as Asian Americans made up the largest subsection of the sample at each of the four waves of data collection (40 –55%). The next largest ethnic-racial subsection at each wave identified as black or African American (15–25%). Individuals identifying as mixed race or multiple ethnicities made up 8 –20% of the sample. Individuals identifying as Latino and Latina made up 6 –12% of the sample and individuals identifying as White made up 2–10% of the sample. Individuals identifying as Native American, American Indian or an Alaskan Native made up 0.3–3% of the sample. Finally, individuals identifying as Middle Eastern ethnicity or race made up 0 –2% of the sample. Data were assessed for cohort effects but indicated no statistically significant differences in study variables or demographics among cohort years. Participants were excluded from the study if they indicated that they were adopted (5% of the sample in 2011, 3% in 2012, 2% in 2013, and 4% in 2014) or an international student (11% of the sample in 2011, 5% in 2012, 2% in 2013, and 4% in 2014) given the unique peer and family context and therefore socialization processes for these individuals. Additionally, individuals were excluded if their responses were insufficient to calculate demographic or study variables that were included in the analysis, see Table 1.

- example of a longitudinal study reporting detailed demographics for multiple waves concisely, in a table (Guideline 5)
- includes not just race/ethnicity (the main focus of the study) but also important related and intersecting background characteristics such as refugee status, being adopted or an international student; in addition to other characteristics (family status) relevant to the study topic of socialization (Guidelines 1 & 3)
- includes a category for mixed race/ethnicity; and uses coded data from participants' own description of their race/ethnicity (Guideline 2)
- in addition to the summary in the table, also explains in the manuscript text which racial/ethnic groups were dominant in the sample (Guideline 6)
- reports and explains which backgrounds were excluded from the analysis (Guideline 4)
Reference: Nelson, T., Cardemil, E. V., Overstreet, N. M., Hunter, C. D., & Woods-Giscombé, C. L. (2022). Association between superwoman schema, depression, and resilience: The mediating role of social isolation and gendered racial centrality. Cultural Diversity and Ethnic Minority Psychology. Advance online publication. https://doi.org/10.1037/cdp0000533
Participants
The present study included 271 self-identified Black women (see Table 1). Participants ranged in age from 18 to 70 with a mean age of 33.92 years (SD = 11.63). Thirteen percent of participants identified as bisexual or lesbian, and 87% identified as heterosexual. Approximately 70% of participants had a bachelor's degree or higher, 21% had some college or an associate degree, and 9% had a high school diploma or General Education Diploma (GED). Sixty-three percent of participants were employed, 27% were students, and 9% were unemployed. Regarding annual household income, 52% of the sample reported earning over $50,000. In terms of relationship status, 41% of participants indicated that they were single/never married. Finally, 44% of the sample indicated that they have received treatment for a mental health condition.

- Reports sexual orientation and marital status in addition to gender (Guidelines 1 & 3)
- Reports three different indicators of social class – education, employment, and income (Guideline 1)
- Reports background information relevant to the topic of the study (mental health treatment) (Guideline 1)
- Reports means on main outcome variables for all demographic categories separately (Guideline 6)
- Information is reported in detail but concisely in a table (Guideline 5)
Reference: Rivera Pichardo, E.J., Jost, J., & Benet-Martínez, V. (2022). Internalization of inferiority and colonial system justification: The case of Puerto Rico. Journal of Social Issues, 78, 79– 106. https://doi.org/10.1111/josi.12437
Sample
We recruited 344 adults (53% male) in public squares and shopping centers in San Juan, Puerto Rico, during two different time periods (January–May 2017 and January–May 2019). Participants were approached by Puerto Rican research assistants, and if they consented to participate, they were handed a portable tablet and asked to complete a 15-minute online survey. Participants' ages ranged from 18 to 79 (M = 41.10, SD = 17.53), and their average annual income was between $15,000 and $25,000. Nearly two-thirds of the sample (64%) identified themselves as White/Hispanics, 18% as Trigueño, 8% as Mestizo, and 5% as Black/Mulatto (specific racial categories in Puerto Rico). Most participants identified themselves as working class, and on average they were politically moderate (M = 5.45, SD = 2.72, as indicated on an 11-point scale ranging from 1 [extremely leftist] to 11 [extremely rightist]). Participants agreed strongly that Puerto Rico was a U.S. colony (M = 5.68, SD = 1.76, on a scale ranging from 1 [totally disagree] to 7 (totally agree). In the context of a mock referendum, participants were asked to report their preferences with respect to Puerto Rico's political status. Slightly less than half of the sample indicated that they wished to maintain the status quo option of holding territorial status (44.2%), nearly a third preferred U.S. statehood (31.1%), and a quarter preferred national independence (24.7%
- Exact time period and location of study is reported (Guideline 1)
- Racial categories that make sense in the local context are reported and this is noted for readers not familiar with the context (Guidelines 1 & 6)
- In addition to a standard measure of political ideology, answers to context-specific political questions are reported (related to the topic of the study) that allow for a more contextualized and refined understanding of the sample's political orientation (Guidelines 1 & 3)
Reference: Selvanathan, H.P. & Lickel, B. (2019). Empowerment and threat in response to mass protest shape public support for a social movement and social change: A panel study in the context of the Bersih movement in Malaysia. European Journal of Social Psychology, 49, 230-243. https://doi.org/10.1002/ejsp.2502
Participants and Procedure [abbreviated]:
(…) a final sample of 422 participants who completed both Time 1 and Time 2 measures were retained for analyses (218 Malays, 177 Chinese, and 27 Indian Malaysians). Table 1 contains descriptive information on participants' demographic characteristics. Participants' age ranged from 18 to 68 (M = 33.46; SD = 9.45), with almost equal numbers of males (N = 213) and females (N = 197; 12 participants did not report their age and gender). As seen in Table 1, although we did not have a nationally representative sample, we obtained participants from a range of religious, economic, and educational backgrounds, who were living in various regions across the country.

- More detailed sample information than in the text is reported in a table (Guideline 5)
- Racial and religious categories relevant to the local context are reported, in addition to location (Guidelines 1 & 3)
- Two measures of social class (education and income) (Guidelines 1 & 3)
- Sample description addresses efforts to obtain a sample that is diverse in various ways (Guideline 6)
Reference: Suyemoto, K. L., Abdullah, T., Godon-Decoteau, D., Tahirkheli, N. N., Arbid, N., & Frye, A. A. (2022). Development of the Resistance and Empowerment Against Racism (REAR) Scale. Cultural Diversity and Ethnic Minority Psychology, 28(1), 58–71. https://doi.org/10.1037/cdp0000353

- Multiracial sample including different racial groups, demographic information reported mostly in a concise table rather than text (Guideline 5)
- Multiracial category included and explained in note (Guideline 2)
- Multiple intersecting social categories reported, including place of birth (Guidelines 1 & 3)
- Multiple options for gender, beyond binary (Guideline 2)
Reference: Tran, J., & Curtin, N. (2017). Not your model minority: Own-group activism among Asian Americans. Cultural Diversity and Ethnic Minority Psychology, 23(4), 499–507. https://doi.org/10.1037/cdp0000145
Participants and Procedure (abbreviated)
We recruited 187 participants through email contact with Asian American organizations in cities across the U.S. (n = 109), through social media platforms (n = 42), through e-mail contact with Asian American student organizations at universities across the U.S. (n = 31), and through Social Psychology Network (n = 5). (…) All participants identified as Asian American (74.2% female; n =138). The mean age was 32.99 years old (SD = 13.67, range = 18 –76). The ethnic breakdown is as follows: 37.6% Chinese, 12.9% Vietnamese, 9.7% Indian, 8.1% Filipino, 7.0% Korean, 6.5% Japanese, 2.2% Taiwanese, 1.6% Pakistani, 0.5% Hmong, 0.5% Laotian, 8.6% mixed-race, and 4.8% other. A quarter (25.7%) of participants identified as first generation immigrants, 68.9% were second generation, and the remaining 5.3% had been in the U.S. for three generations or more. The sample was well-educated: 76.8% had earned a 2-year college degree or higher, 4.3% had a professional degree, and 18.8% had a high school degree. One third (33.2%) of the sample had an annual household income between $0 and $49,999, 30.9% had an annual household income between $50,000 and $99,999, and 35.9% had an annual household income of or above $100,000. Participants identified mostly as liberal (68.5% liberal, 19.6% neutral, and 12% conservative).
- Ethnicity is reported in addition to race and all groups are reported, not just the most common one (Guidelines 1 & 3)
- Immigration background (first, second, third generation) is reported (Guidelines 1 & 3)
- Two indicators of social class (education and income) (Guidelines 1 & 3)
- Political ideology is reported (Guideline 1)