
Each academic year, approximately 250 students complete a social and personality psychology graduate program. This past summer, the SPSP Student Committee conducted a survey to better understand the experiences of students who attempted to secure a position in academia. SPSP members who received a PhD during the years 2013–2019 were emailed a link to the survey (1270; not including 38 who had opted out of emails), and 308 members responded (24%).
Note: The respondent sample was more heavily female (59.4% vs 55%) and more heavily White (70.1% vs 63%) than the eligible population.
Gender
Ethnicity
Source/method
How did you search for jobs?
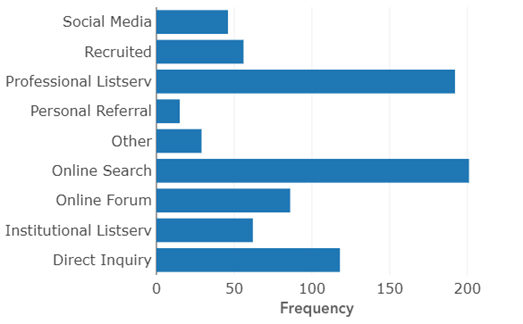
It appears that professional listservs and online searches are the most popular sources of searching for job opportunities. However, there is still variability among the other options.
Resources
What resources are most helpful when searching for a job?
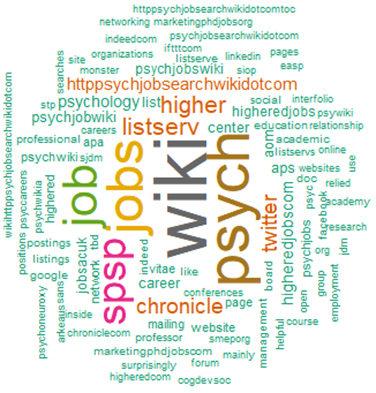
As illustrated by this word cloud, Psych Jobs Wiki, SPSP Listserv, Twitter, and Chronicle of Higher Ed are some of the more popular resources.
Timeline
A job search can often span several years. How does the scope of a job search change over time?
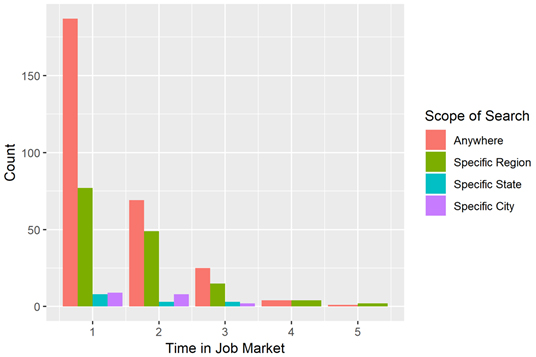
Fewer people seemed to be in the job market on 4 or more separate occasions, and the geographic scope of the initial search is much broader than later searches.
How does the number of internal awards vary over time?
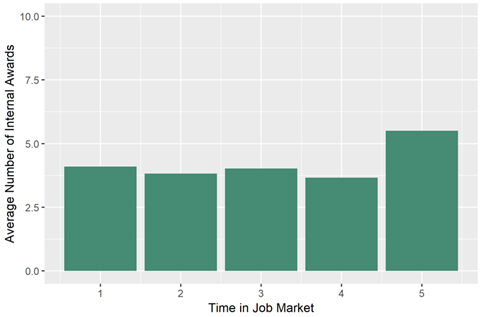
The average number of internal awards seems to remain stable at all time points, except at time 5.
How does the number of presentations vary over time?
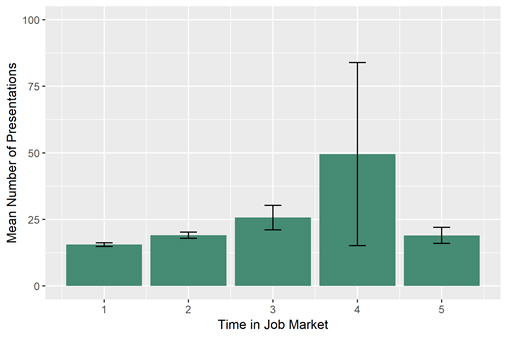
The number of presentations appears to increase over time, except at time 5. However, there was an outlier present in this data. Therefore, we have included error bars for better representation of the data.
Other considerations
Did partner or family considerations influence the scope of the first job search?
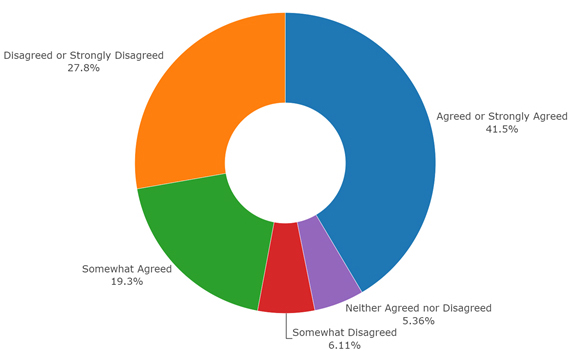
The majority of job candidates did factor in a partner or family's needs when searching for their first academic job.
Conclusion
Taken together, it seems there is much variability in people's experience on the job market. However, the goal of this article was to provide an overview of people's experiences in an attempt to demystify the process of applying to an academic job.
Future articles (Part 2 and Part 3) in this series will explore how certain qualifications (e.g., presentations and publications) relate to job outcomes (whether or not an offer was received). Please email any questions or suggestions about this series to [email protected] with the subject line "job market survey article series".
Acknowledgments: Thanks to Heidi Anahi Vuletich and Fernanda Chardulo Diad De Andrade for their contributions to this article.

Grad Student's Guide to AI: Top Platforms to Boost Your Academic Success (Part 2)

Introduction from New SPSPotlight Co-Editor Milena Dasilva-Braga
