
With the amount of statistical software out there, it’s easy for grad students to be overwhelmed and just use whichever software their advisor uses or happens to be taught in their first-year statistics courses. Very rarely do we hear about software directly from the developer, who may be better able to explain the details and give answers to questions we might not have thought of yet.
Jonathon Love is a co-founder and developer of jamovi, a statistics software available for all platforms that is not only intuitive and user-friendly, but also free.
What is jamovi? What can it do?
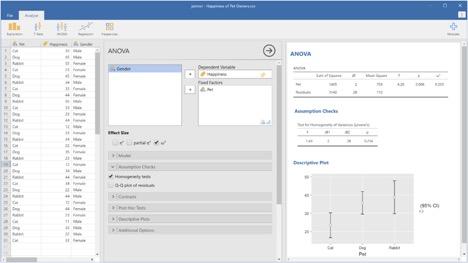
jamovi is a user-friendly, open statistical spreadsheet, designed to be as simple to use as possible, but still allow very sophisticated analyses. You can see it in the screenshot below – we have the data to the left, results on the right, and if you’re running an analysis (such as an ANOVA like below) the analysis options in the middle.
jamovi provides all the usual analyses necessary for undergraduate statistics programs (t-tests, ANOVAs, regression, contingency tables, etc.), (and it’s been exciting to see a number of universities adopting it into their programs!). But it’s more than an educational tool – it contains many useful features for advanced researchers too, including linear mixed effects models, generalized linear models, and a sophisticated data transform and recoding system.
What is the difference between jamovi and SPSS?
The biggest difference between jamovi and SPSS is that jamovi is much simpler and easier to use. In jamovi, when running an analysis, the results update as you change the options. So you can specify your variables in say, an ANOVA, and you’ll receive an ANOVA table before you click ‘OK’. This lets you go on to make interactive changes to the analysis. If you want to see an effect size, you click that checkbox, and the existing ANOVA table updates to include it. Contrast this with SPSS where you have to specify your options, press OK, and then wade through a torrent of output. If you want to change something, you have to go back and re-run the whole analysis, receiving another torrent of output. The ‘direct feedback’ model dramatically simplifies this whole process, and makes the learning and practice of statistics simpler and less overwhelming. There are a lot of other differences, but this is the one that people love most.
What is the difference between jamovi and R?
jamovi is different to R in that it’s a graphical statistical spreadsheet rather than a programming language, but jamovi and R are actually great friends. All the analyses in jamovi are written in R, and you can put jamovi in ‘syntax mode’ where it displays the equivalent R code to recreate the analyses in an R session. In fact, there’s even the Rj editor for jamovi, which lets you type R code and run it directly inside the spreadsheet itself! We wanted to make it as easy as possible for people to transition from a spreadsheet to R if that’s the right next step for them. So if you like the comfort of a graphical spreadsheet, but would like to take some tentative steps toward learning R, jamovi is a great place to begin.
Can you tell us about the jamovi team?
So there’s myself, based at the University of Newcastle, Australia. I mostly work on the underlying architecture for jamovi, the “under-the-hood” stuff. Then there’s Damian Dropmann based in Sydney, who’s our user interface designer and developer. A lot of our best user interface concepts have been designed by him. Then there’s Ravi Selker based in Amsterdam, who’s primarily responsible for the analyses in jamovi. Ravi has a rare thoughtfulness and careful attention to detail which have made for a pretty extraordinarily well-refined set of analyses.
The three of us are the core developers, but jamovi is much bigger than us. jamovi is a community project with dozens of other people working on additional materials; online textbooks, video tutorials, new advanced analyses, etc. Science works best when we can build on each other’s work, and so we’ve made community a central aspect of jamovi development.
How can someone get started with jamovi?
jamovi is pretty straightforward to use. I’d recommend downloading and installing jamovi, and just playing around with the example datasets. For people who prefer a more guided experience, I can recommend the jamovi tutorial series provided by Barton Poulson of datalab.cc https://datalab.cc/tools/jamovi, or there’s the learning statistics with jamovi textbook: https://sites.google.com/brookes.ac.uk/learning-stats-with-jamovi. But if you’ve ever used SPSS before, you’ll feel right at home using jamovi – and probably a lot happier.
We hope you enjoy using jamovi as much as we enjoyed creating it.
Download the jamovi software and get started!

Grad Student's Guide to AI: Top Platforms to Boost Your Academic Success (Part 2)

Introduction from New SPSPotlight Co-Editor Milena Dasilva-Braga
